AAPL bull put spread: Mar 125p/120p: AAPL=133.27. max profit realized=(6.20-3.85)*200-14.95*2=440.10. P/L=88.7%
GRMN bull put spread: Mar 60p/55p, credit=2.3: GRMN=60.13. stupid, I covered the 60p leg. Otherwise max profit would have realized. Loss=(3.8-1.5-6.4)*200-14.95*3=-864.85. Original max loss=(5.0-3.8+1.5)*200-14.95*2=510.10.
DIA iron condor spread: Mar 114p/116p/130c/132c: DIA=123.11. max profit realized=(0.15+0.52-0.06-0.32)*500-14.95*4=85.20. P/L=17%
Ongoing April spreads:
CMP Apr 55c/60c: CMP=57.65. in loss region.
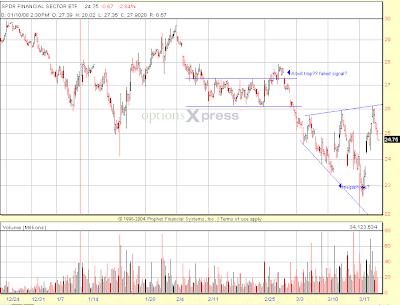
XLF Apr 18p/20p: XLF=26.32, in max profit region.
Lession: a max profit spread realized a much bigger loss because of adjusting.
Thursday, March 20, 2008
Wednesday, March 19, 2008
Sunday, March 16, 2008
Mar16 weekly chart reading
DIA: It didn't go above 126 but 123 has reached. Too bad I still didn't open a put position although the prediction was right for the past few weeks. In the next week it may form a flag pattern and then break down.
$COMPQ: It went as expected. Now it should go back to the down channel again. A flag pattern is there.
$USD: it looks like a new down channel.
GLD: prediction was right. It will go up in the next week.
XLF: wrong prediction.
GS: it tried to bounce back but didn't get it through. Too bad it went down again.
BIDU: breakout on the upside but met the resistance from EMA50. It will go down.
FSLR: it got stuck. Waiting for the breakout.
GRMN: still hopeless.
$CPC: correct prediction, it went up. Now it should go down.
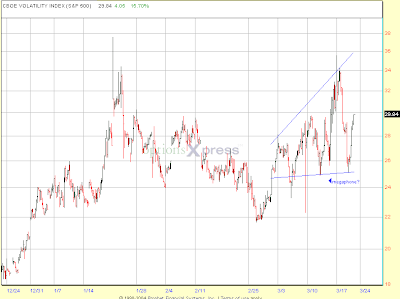
$VIX:
UYG: trend reversal didn't happen and I don't expect it any longer.
1. Financial
C: wrong prediction, it will go down, the volume is huge.
JPM: it did reach 40+ but then went down.
2. Technology
IBM: it went up a little bit and then down. The near term down trend should have started.
AAPL: still range-bounding. It will go down in the near term no matter it's triangle or flag pattern.
GOOG: it went a little bit up and now it should go down again.
MSFT: it went up and down. In the near term it will go down.
T: correction prediction, it went up and reach 36, and then down.
RIMM: it looks like a up trend. Will it form a new down bottom pattern?
3. Resource
XOM: wrong prediction, in fact it went up sharply. The volume is bearish, and STO is about to change direction.
4. Transportation
DRYS: almost right. it will go straightly down.
FDX: correct. It closed at 85.
UPS: correct. it will go down this week. The target is 66.
5. Industry
BA: it went down to 72.5 and then bounced back. The trend is up but it hits the resistance already. So the up trend needs to be confirmed.
GM: correct. The next target is 18.
DD: wrong. It went up sharply. it will go down.
MMM: it went a bit up and then down. Good short target.
6. Medical
JNJ: still range-bounding. it went a bit up and will go down.
7. Food, consumer
MCD: wrong prediction. it went up. it will go down.
PG: correct prediction. The flag pattern is over soon and it should go down in the near term.
KO: correct. It broke out downwards. The next target is 55. Good short target.
WMT: correct. Now it should have a minor downward correction.
8. ETF
VWO: correct, target reached, it will go down.
EWZ: range-bounding. it will go down.
ILF: similar as above.
FXI: go down sharply.
XLE: wrong, it went up a little bit. Now it looks ready to go down.
XLB: same as XLE.
GDX: it is still going up. It's bullish.
DBA: wrong. Now it looks bearish.
MOO: wrong. it went up.
Subscribe to:
Comments (Atom)


