Saturday, September 06, 2008

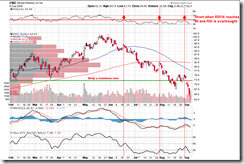
EWZ: it may drop further down

P&F chart:

ewz-pf

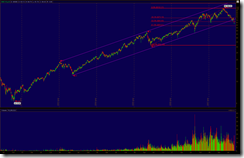
Weekly chart:

ewz-weekly

No sign of bottom yet!

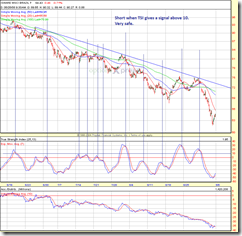
Daily chart:

ewz-daily

$72.5 is a resistance now.  Later it is safe to short it everytime RSI14 reaches 50 and RSI becomes overbought.

Long-term wave structure:

ewz-wave

Wave 3,4,5 on the weekly chart:

ewz-wave-w

PLAN: Close the position as soon as wave B is finished (not started yet); short it.

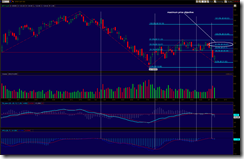
60-min chart:

ewz-60m

The plan is written on the chart, and the success rate is VERY HIGH!

POT: where will it go?

Weekly chart:

pot-weekly

On the weekly chart, there is no evidence the pullback has finished.  POT will likely go down further in the yearly frame.

pot-daily

RSI14 on the support.  MACD shows positive divergence.  So it may start to rise now.  However, $182 is a resistance and it may pull back there.  Depending on the strength, it may or may not go above to Fib 50% to Fib 61.8%.

Wave counting:

pot-wave

Note the chart shows the best scenario.  After this wave is completed, one should close the position and watch what the next direction is.

P&F long-term analysis:

pot-pf

6 Sep 2008 Weekly Market Analysis

Market glance:

glance

Note that XLF is having a whipsaw.  Other than that, the mid-term trend is confirmed down.

SP500 daily chart and wave counting:

spx-wave-daily

If we inverse the SPX chart, it does look like a bull market.  This is why I believe we are in a bear market.  All comments are on the chart.

XLF daily chart and wave counting:

xlf-wave-daily

I am not saying the correct wave counting is correct but most likely this is the best scenario that bulls can hope for.  Pay attention to the Near-Term Trend comments.

SP500 60-min chart:

spx-60min-wave

I guess the market will open at 1260 and dive down to 1250, then goes up to 1270+.  If it doesn't drops below 1260 on Monday, most likely it will go straight up to 1270+.  Because the resistance between 1260-1270 is quite heavy, I don't expect it goes straight above to 1280+.  Be reminded that the mid-term trend is still down.

XLF 60-min chart:

xlf-60-min-wave

It does look quite strong.  I expect the next reversal happens at about 22.5.  Note that the Acc/Distrib lines has not decisively dropped down yet.  This is consistent with the current range-bounding situation.

SKF 60-min chart:

skf-60min

Everyone knows SKF is going down.  It seems the correction wave is not completed yet, let's be patient.  I expect the minimum target after the correction wave is from 130 to 140.

QQQQ 60-min chart:

QQQQ-60-MIN

I am not very sure about QQQQ.  But it seems the technology sector is very weak so I don't expect a strong rally.  It will lead the rebound in the next week.

DJIA 60-min chart:

indu-60m

The Acc/Distrib line looks unusual.

VPCI analysis on SPY and XLF: it doesn't seem very clear or accurate

SPY daily:

spy-vpci

XLF daily:

xlf-vpci

XLF: where is the financials going?

Take a look at the weekly chart first:

xlf-weekly

Now it is range bounding, and the previous trend is downward, so we cannot confirm it is bullish at the moment.  The candlestick pattern of the past two weeks looks like a hanging man, which is a consolidation or bearish reversal.  We need to wait for the confirmation.  The chart also shows that bulls and bears are fighting around $22 line, and a decisive breakout above 22 or under 20 will be a clear signal to the next trend.

How is the long term trend then?  Here is the P&F chart:

xlf-pf

The chart shows that the first defense of bears is at 23.  Breakout above 23 will corner bears to retreat to 26.  Bears will be defeated once XLF closes above 26 decisively.

Now look at the daily chart:

xlf-daily

Firstly, XLF is still bounded in a range between 20- and ~22.5.  Next, note that the range between Fib 50% and Fib 61.8% is a previous consolidation zone.  The volume within this region is quite heavy, so I expect XLF consolidates for an extended period.  Closing above 23.7 will mean the trend is strong and the bearish trend has been reversed.  We can also see a new trendline but it can be broken easily without any meaning.  In my opinion, MA(50) seems like a support but it doesn't mean anything either, maybe it could provide some hope to bulls.

How is SKF -- the UltraShort Financials -- doing?  Just take a look at a simple P&F chart:

skf

Remember to disregard the price objective because I don't think it makes any sense.  On the chart, 108 looks like a good support, but it has been broken during the after-hour trading.  Then it may go straight down to 104 and 99.  Depending on how XLF goes, the next reversal point will be likely between 97--99.

转载: 如出一澈的两步棋 - 大熊也许到此收兵了

来源: c101_237
Image and video hosting by TinyPic
仔细检视一下上面这幅NAZ的60分钟图,NAZ 从七月中旬以来的300点上涨与随后的220点的下跌,从形态上来看,简直就是如出一澈(只是方向不同而已)。
在经历了单日3.2% 的剧烈下跌后,NAZ 已到达根据P&FChart 计算的Price Target 2260:
Image and video hosting by TinyPic
考虑到VLE仍维持在50DMA 以上,而$NASI 今天未能向下打破它自己的10EMA(这是两个俺个人觉得十分可靠和倚重的买卖指标),虽然不能指望市场能立刻止住它本身下跌的惯性,但根据历史如果这两个指标不能随着变熊的话,在此继续做熊SHORT的盈利空间可能已经不太大了(接下来的GAME,很可能是要依靠市场上下拉动产生的VOLATILITY 来带动 - always do your own DD):
Image and video hosting by TinyPic

转载:做中长线须知:趋势线的正确和错误画法

来源: 海边玩人 于 08-09-05 18:18:53

有人凭着一把尺子叱咤股市,打遍江湖无敌手;也有人认为只凭一把尺子闯股市是个天大的笑话。是独门功夫还是笑话,区别在于画趋势线功力的高低。
上班族炒股,最好打持久战,做中长线,并且精通一、两个炒股工具,将其真正的吃透,成为自己的独门功夫,如:趋势线和道氏理论、均线和布林通道、KDJ和 MACD、艾略特波浪理论、等。画趋势线是做中长线的基本功:看什么图、如何画趋势上下轨、随着时间推移如何修改上下轨、修改前后的差别说明了什么、如何判断真假出轨、为什么出轨后支撑线往往会变成压力线、如何将趋势通道与均线和布林通道相结合、等。当你能将图形和买卖的行为相结合时,就入门了。
趋势线画得正确与否,不是某个高人或者资深专家说了算,而是得由市场来鉴定。股市里只有市场这一个股神,拜错了神一定会受到市场的惩罚。所以炒股一定要拜市场为老师,而不是跟某个DQ的高人。要建立一门自己的独门功夫,需要跟随市场这位老师,潜心专研几个月甚至几年,不断做功课不断向市场请教,才能学好学精。
下面是我画趋势线的体会,正确与否,得由市场来裁判,只能做为抛砖引玉,或者提供点启发。

一、一年以上收盘价,画上下两条切线

经典道氏理论规则,断定趋势只使用收盘价。因为当天的各个价位意义是不一样的,一般来说,开盘价是由交易所定的,是交易所抄盘手的感觉,现在很多是盘后交易的结果,因为交易人数少、交易量低,所以是一部分人的交易结果,也可能受人为的操纵;最高价和最低价,是买卖双方当天一方最强的时候;收盘价是买卖双方当天斗争的结果,所以比较代表当天的股票行情。
正确画法:
1、将价格的几个最低点画一条切线,就是趋势通道的下轨,也叫支撑线(Support);几个最高点画一条切线,就是趋势通道的上轨,也叫压力线(Resistance)。
2、在相应的交易量上画切线,用以判断是放量还是缩量。
3、跨度需要起码一个月以上,甚至一年以上,平均三个月。
4、趋势线触到的点,需要起码三个点以上,而不是两点成一线。
错误画法:
1、两点成一线,永远不会出轨。
2、通道宽度太窄,太多出轨;或者太宽,很少出轨。
3、太多线条,将所有的可能性都包括了:上升、下跌、横盘。
4、修改次数太多和毫无道理地进行修改,成为墙头草左右摇摆。

说明:
使用趋势线来判断股价正常和出轨情况,最后的趋势,意义最大。
1、在正常情况下,股价在趋势通道的上下轨之间运行,一般在通道的中线与上下轨之间反弹,有时碰到上下轨才反弹。说明没有重大基本面改变的。
2、有时股价在碰到上下轨时不反弹,而是冲破上下轨(Breakout),并且往往伴随放量,即为出轨。暂时的出轨是经常的,真正的出轨几个月里只有一、两次,所以需要学会判断真假出轨。真正的出轨,往往会将压力线变支撑线,或者支撑线变压力线,可以作为出轨的确认信号;假出轨只是人为的操纵,是兔子的尾巴长不了,很快会重回轨道内。出轨说明有重大基本面的改变,事后有可能从消息面得到证实。
3、使用趋势通道的斜率来判断趋势是牛还是熊。通道上下两轨的斜率也可以组成一定的图形,如三角形、旗形、楔形等,用来判断股价走势。但是这是图形专业范畴,不在趋势专业的讨论范围。
4、一般来说,放量表明交易量支持股价的走势,缩量表明交易量不支持股价的走势。
5、上升和下跌过程中的交易量,表明买家和卖家的情况:上升时的交易量越大,表明买家很多,将来的卖家也会很多,所以下跌波浪来时也就越剧烈;下跌时的交易量越大,表明卖家很多,将来的买家也会很多,上升波浪来时也就越高涨。突破时的放量,往往表明有新的买家或者卖家进场。

二、一年以上收盘价,画一条切线一条平行切线

趋势线的一个重要意义,是判断股价的趋势不变还是趋势反转。一旦趋势反转,形成股价的顶部或底部。正确判断顶部或底部非常重要:上涨中的股票任何时候买进都是正确的,除了顶部;下跌中的股票任何时候卖出都是正确的,除了底部。
在下跌的趋势中,熊通道,突破上轨的意义,比突破下轨更重要:下轨支撑线的突破,只是表明熊气更浓了,熊趋势不变。上轨压力线的突破,才表明趋势可能从熊向牛转变了,形成底部。
在上升的趋势中,牛通道,突破下轨的意义,比突破上轨更重要:上轨压力线的突破,只是表明牛气更强了,牛趋势不变。下轨支撑线的突破,才表明趋势可能从牛向熊转变了,形成顶部。
正确画法:
1、在下跌的趋势中,将价格的几个最高点画一条切线,即为趋势通道的上轨,压力线。选择一个价格的最低点,画一条平行于压力线的直线,即为通道的下轨。
2、在上升的趋势中,将价格的几个最低点画一条切线,即为趋势通道的下轨,支撑线。选择一个价格的最高点,画一条平行于支撑线的直线,即为通道的上轨。
3、在相应的交易量上画切线,用以判断是放量还是缩量。
错误画法:
1、在熊通道,只画下轨支撑切线;在牛通道,只画上轨压力切线。
2、错误判断真假突破。

三、一年以上蜡烛图,画趋势线

经典道氏理论规则里只使用收盘价,对趋势的判断比较准确,但是收盘价对当天的价格波动,没有太好的指导作用,所以很多人使用蜡烛图画趋势线。蜡烛图噪音太多,正确画线的难度很大,但是画好了比只使用收盘价的功力高。

四、五天五分钟蜡烛图,画趋势线

做中长线,交易次数少,但是总是要交易的。交易当天,就得看短线趋势了。虽然短线使用MA、KDJ、MACD等指标更好,但是学会正确画趋势线,仍然是个很有用的工具。
因为五分钟股价走势往往上下波动很大,所以正确判断是否出轨是个大挑战。
正确画法:
1、在五天五分钟蜡烛图上,将价格的走势分几个趋势段,画趋势通道。最后一段新形成的趋势,使用前面的趋势通道宽度,来判断是否出轨。
2、正确判断是否出轨,应该在突破通道上下轨后,超出 2/3 通道宽度以上才比较准确。还得记住,股价在一天内可以有很多次的趋势转变。好在做中长线,只需在当天的比较低点买入,或者比较高点卖出,就不再关心其后的走势了。不要指望买在当天最低点、卖在当天最高点。

说明:
1、保持通道宽度是画短线趋势线的关键,否则会混乱。可以在透明纸上先画好通道,再去图上对应最后的趋势,判断是否出轨。
2、买入信号,最早是KDJ金叉向上;迟一点的,是MACD金叉向上;再迟一点,是股价碰到10MA、20MA、50MA等均线;其次是出轨甚至压力线变支撑线或支撑线变压力线时;最后机会是出轨到超出 2/3 通道宽度以上。当然,数浪也可以得出早期的信号,取决于各人的功力。越早利润越高但是风险也高。几个信号结合起来用,赢率高。
3、卖出信号相反。
4、以上的买入信号、卖出信号,同样适用于中长线,只是需要看一年以上的图,而不是五天五分钟图。

五、网上找到的图

Futures trading: week 1

Since the beginning of September, I decided to open a paper trading account with optionsXpress for trading the index futures.  The purpose is to practice and to verify my market reading, as well as discipline and emotion control.

Starting capital: $10,000.00

Basic rules: swing trading only, cut loss quickly, no over-trading; trade NQ and ES only in the first stage; no resetting account before it gets wiped out.

First week trades:

1

Profit/Loss: 6.47%.