Saturday, September 13, 2008

Container board sector chart analysis

Here is the candle glance of this sector vs SP500 index:

image

Comparing with the broad market, it seems they are doing pretty well.  We are focusing on PKG, SSCC, and TIN.  Now let's look at how they performed during the past 5 years:

compare-5y

... and during the past one year:

compare-1y

From the following two charts, it can be seen that:

  • TIN has the greatest volatility;
  • PKG usually goes with the broad market;
  • SSCC is between TIN and PKG.  Over the past few years, SSCC underperformed and now it is bouncing back.

Now let's check these three stocks one by one.

TIN:

10 year weekly chart:

tin-10y

It performed very well in the past few years but since 2007 it has been going down until recently it is recovering from the historical low?  Because the price drop happened before drop of the broad market, it is prudent to understand why.

Daily chart:

tin-d

Over the near term it is oversold.  Now it is right at the resistance.  Once it breaks the resistance, it may fill the runaway gap -- however there must be a reason behind the strong upside movement.

60-min chart:

tin-60m

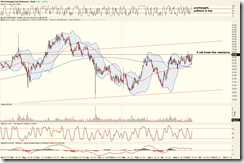
The chart is neutral to a little bit bearish because the upside resistance has not been broken out yet.  After the potential breakout, it should be a good trade to open long position and set stop below the resistance level.

Daily chart with VPCI:

tin-vpci

The volume-price moderately confirms the bullish trend.  Again, we have to see the breakout first.

SSCC:

10 year weekly chart:

sscc-10y

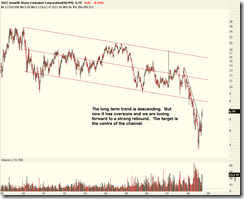
This stock has spent its life on moving in a descending channel.  Since the middle of 2007, it dropped much quickly than before and now it is recovering.  Hopefully the rebound can touch the lower edge of the channel, which will be a hefty profit!

Daily chart:

sscc-d

It is overbought in the near term (sorry for the mistake on the chart).  However the breakout from the year long downward trend line is still valid, and I hope it can go up again after a correction.

60-min chart:

sscc-60m

The TSI and Chaikin oscillator have an obvious negative divergence with the price movement.  Most likely it will go down from the current level and retest the previous resistance level.

Daily chart with VPCI:

sscc-vpci

Breakout is valid, and the price-volume confirms the trend.  However a pullback is due.

PKG:

10 year weekly chart:

pkg-10y

The chart pattern looks very bullish.  Regardless of the broad market condition, it seems this stock keeps going up all the time.  The question is how long the trend will last?  There must be some fundamental reasons.  On the other hand, the volatility is huge so it is wise to choose a good entry point.

Daily chart:

pkg-d

The resistance ahead looks not strong enough and it will be broken quickly.  In the near tern PKG is overbought and now is not the best point to open a long position.

60-min chart:

pkg-60m

The momentum is going up, and a support level is sitting at 24.5.  I expect it go up a bit and then come down.  Depending on whether or not it breaks the support, the trade can be long or short.  Of course the short should be short-term play and is for speculation only.

Daily chart with VPCI:

pkg-vpci

The chart looks neutral, and the VPCI indicator does not confirm or invalidate the price movement.  After the consolidation, a long position can be opened if the resistance is broken.

Other stocks in the sector:

IP:

ip

Overall trend is bullish.  The second time breakout does not have a heavy volume.  It will likely retest the support level.

WY:

wy

This stock looks bullish, too.  However it has to break the resistance and hold the blue upward trend line.

IMMR and CSUN

For speculation only.  I won't trade them, just keep on the watch list.

IMMR daily chart:

immr-d

CSUN daily chart:

csun

Candle glance of solar sector

solarsector

转贴:三年回顾 by BlueYuan

发信人: blueyuan (sky), 信区: Stock
标 题: 三年回顾
发信站: BBS 未名空间站 (Sat Sep 13 13:58:04 2008), 转信

其实很造就想写了.因为上了街,以后没时间,也不能多在这谈啥具体的股票了.所以想把自己的一些经验总结总结,希望能给大家一些借鉴. 不过过去的一两个月一直在忙,忙毕业,忙新工作.终于找了个这个周末,啥不用做,就简单谢谢3年来的一些经验.

先简单show off 一下. 我2005年8月开始接触美国股市,到现在正好3年时间.帐户曾经短短2,3个月涨了10倍,然后又从缩水到接近于0.后来总结改进,截至2008年8月帐户大概涨了8倍左右.

通过这上上下下的几翻折腾,我有几点感触,觉得可能会对大家有帮助.

第一:option不是用来抄的,是用来hedge的.尤其是对于没有闲钱的人来说.抄option风险过大.往往会导致犯非常低级的决策错误.想要靠单靠操作option发家致富,我觉得可能性非常非常小.建议一般投资者都不要尝试.我2,3个月翻10倍是从option上赚来的,但是1个月打回原形也是因为它.

第二:抄股是副业,不是主业.很多人因为抄股,失去了很多自己的生活,甚至是自己的主要工作.这很不值得.失肯定大于得.还是要用平常心来看待赚钱和亏钱.要坚决相信劳动才能致富的道理.

第三:抄股不能片面的相信牛人,不能片面的相信TA,也不能片面的相信FA.单一的依赖任何一向,往往结果不会太好.

股板很活跃,有很多大小牛人,如果经常看看股板,基本能看到市场的焦点,热点都能在这里得到体现.看看大家的pick和讨论是可以给你一定的方向概念的.至少我能感觉到.但是,如果不加思考的盲从,那多数是不行的.因为一是牛人也有错的时候,二是,牛人的意见也往往不统一.所以下一步需要自己看图.

TA其实是一种能快速告诉你股票整体健康程度的指示针.图看多了,你大体会感觉到股票的好坏.但是绝大多数的TA信号是有矛盾性的.而且经常进入你搜索雷达的,TA信号很好的股票,他们都已经是强弩之末了.所以不能简单依靠TA信号来决定投资.可以对TA好的股票进一步做深入的FA研究.

做FA要花时间,简单点你也需要看看公司最近几年的财务报表.复杂点你就需要对财务报表做点处理,再复杂点你还要根据公司以往的业绩,目前的产业环境,大的经济环境来预测一下未来1年的财务状况.最后这一项很考本事,但是从中你也能学到很多东西.如果你真的喜欢投资,其实应该在这上面花点功夫.

通过牛人提示,TA挑选,FA再挑选出来的股票,中标率提高了很多,但是还是可能会出错的.所以这就最后需要提高自己的实际操作水平了.

入点,出点可以根据TA来选择.这往往在短期内还是比较准的.同时操作要灵活.在趋势明显背离自己的分析的时候,要能够承认自己的错误.至少在操作层面上要承认.然后要感觉对自己的position进行适当的调整.

具体操作层面上我有几点感触:

1.永远不要满仓操作,无论趋势和你分析的多么的一直,或者你多么的有信心.坚决不满仓,给自己要留调整的余地.

2.不要轻易的average down.如果走势和希望的背离,即使你不打算割肉,也不要随意补仓.

3.股票在底部和顶部往往都有多次的强烈振荡期,在这个时候,要利用在美国可以T+0的条件,果断的多次进出来调整自己的position.这个操作要果断,这时是考验你心理素质的时候了.

另外我建议新手可以从极短线操作开始入手,逐步拉长操作间隔.短线操作多数不能赚大钱.psp这种大师另说.但是短线操作可以让你尽快了解股市.当你有能力做更复杂的分析后,逐步拉大操作间隔.我个人觉得,对于一般的散户,由于在信息面上要比institution吃亏很多,不太可能对3个月以上的发展做出准确预测,所以最终操作间隔放在1个月到3个月之间比较理想. 只有象buffet这样具体极强分析能力和信息来源的机构和个人,才适合做1年以上的投资.当然这也需要有强的资金实力.否则我也不太建议做buy and hold.

胡乱说了几句,大多都是我的一些lesson.希望对大家有点帮助.

另外给股板提个建议,不要经常性的开赌局.股票不同于赌博的地方就在于抄股是有信息可以分析的.经常开赌局助长了大家的赌性,其实对广大青蛙不好.还是应该多鼓励有意义有内容的分析,少一下我预测...

希望大家都发财.

Future trading: week 2

Balance: 11269.80, Profit/Loss: 12.7%.

activity

During the past week I was too busy to watch the market and do DT.  Only in the Monday morning I traded ES and NQ.  I shorted ES but was stopped out.  Actually I would rather to be stopped out with tiny profit than turning profit into loss.  As soon as I see some profit, I will move the stop order to protect myself.  Unfortunately I didn't get in again.

es

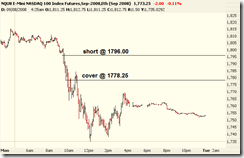
I shorted NQ as well and was stopped out because of the spike.

nq

Although the major part of the trend was missed, at least I didn't lose which is good.  The problem is I cannot watch it for all day long, so can only do one or two trades a day to catch a big move instead of scalping many times.  Anyway, I just do it whenever I am free and see how it goes.

EWZ update: it may go up

For more information, read the last report.

Wave counting chart:

ewz-d

Daily chart:

ewz-d2

Has the wave A finished?  Let's see how it goes next week.

12 Sep 2008 Weekly Analysis (II)

SP500 daily chart and wave counting:

Here is the update of the chart in the last weekly analysis.

spx-d

XLF daily chart and wave counting:

Update of the last chart.

xlf-d

I also have a SKF daily chart as follows:

skf-d

SPX 60-min chart:

The upside target is 1270. After reaching (or overshooting) that point, I expect a downside movement. Will the rate cut by Fed be a stimulus to the spike? Let's wait and see.

spx-60m

XLF 60-min chart:

It was weaker than my expectation. I still look forward more upside movement before diving down.

xlf-60m

QQQQ 60-min chart:

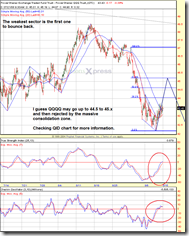
No touching it for now. It was the weakest but might become the earliest sector that bounces back.

qqqq

QID 60-min chart:

It is bearish. Wait and pick it up later.

qid


Here are three P&F charts.

SPX:

spx-pf

XLF:

xlf-pf

SKF:

skf-pf

Intraday chart for ESZ8:

Friday, September 12, 2008

12 Sep 2008 Weekly Analysis (I)

Market glance

Note that the whipsaw on XLF has disappeared.  All mid-term trend signal is down.

market glance

SP500 is going up because US dollar is appreciating

Here is weekly chart which compares the following four indices:

  • $SPX:$USD: the US market;
  • $MSEAFE: Europe, Australia, and Far East markets;
  • $MSWORLD: the world market excluding US;
  • $MSEMF: the emerging market.

After taking account into the appreciation of the US dollar, it is obvious the market was actually dropping instead of rising during the past few weeks.

world market

Here is the daily chart:

world market -d

Here is the performance comparison during the past year:

market comparison 1y

and during the past 90 days (note that the markets all over the world seem being synchronized).

market comparison 90d

Comparison between US, Hong Kong, Singapore, Japanese markets, and the world average during the past 180 days.

country comparison 180d

Comparison between different sectors in the US market

sector comparison 1y

Conclusion:

During the good years, the money will flow to the emerging market.  However the money will flow back to the US market during the bad times because the volatility of the US market is relatively small.  When the bull market is coming, we should definitely invest in the emerging market.  Wish respect to different sectors, it is difficult to say which one will survive the best but the energy sectors seems doing well in general, of course the entry point is critical.

Thursday, September 11, 2008

11 Sep 2008 Daily Charts

The rebound is much stronger than what I expected yesterday.  Now wave iii finished and the wave a is approaching to an end.  I expect a down and up on SPX and XLF.

SPX 60-min chart:

spx

XLF 60-min chart: I expect SKF goes under $107 and I plan to buy some at appropriate price level.

xlf

QID 60-min chart: It has dropped but will go down further.

qid

Charts from BPT

SPX wave counting, final potential target: 1070-1080.

SRS may go up.

$CRX looks very bearish.

$WTIC

Wednesday, September 10, 2008

10 Sep 2008 Daily Charts

I expected a moderate rebound today but actually got a very weak one.  Because the previous wave was quite violent (went beyond 1.618 a bit), so the current one will probably break the previous low and might reach 1193.5.  The final target before seeing a upward correction is about 1170 which is consistent with two different estimations.  Before reaching 1170, I will not consider opening long positions.

SPX 60-min chart:

spx

XLF 60-min chart: I do think that XLF has started to sell off and it is not bullish at all.

xlf

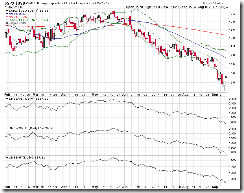
QQQQ 60-min chart: I dare not to touch it at the moment.  On the chart it seems QQQQ may bounce back sharply any time.  And the money is flowing in despite of the recent selling-off.
qqqq

QID 60-min chart: previously I estimated the target of QID was 50.63 but I didn't know it could reach this high so quickly.  On the chart you can see that it could drop any time!

qid