收盘小结:
今天石油继续暴涨。所有ETF中,涨的最凶的都和石油有关。从收盘情况看,仍然有新的资金进入,暂时没有下跌风险。
10-yr T-note和30-yr T-bill暴跌,成交量增大。这个对股市是利好。
从周线图上看,今天是周末,突破了前几个星期的盘整区域,所以从图形上看中期看牛。
以前的波浪图需要重新看,晚上再说。
我的感觉是,既然冲过了918前一个高点,下来很可能到950。但今天还是假日,情况未必是真实的。
看蛇老大的图:
001指示的很可能是大盘的顶部。
002:技术指标超买,但pattern突破,另外最近几天成交量一直上升(有假日缘故),所以超买不一定算数。
其它短期的日线图上看,怎么都已经超买了,技术上需要回调。
所以现在信息不明确,作空暂时要作为短期仓位处理。XLF是各个sector中比较弱的。我认为下一个交易日不一定马上下跌,所以建议大家观望,盘后不要进入,等周一。进入的暂时拿稳,熊市作空终究是可以出水的。
另外,为了安全起见,不建议long 3x ETF,因为母鸡的过程中损失比较大。3X ETF适合去short。我进入BGZ是头一次,那个账户不能short,我准备最多拿5天。
谢谢!
Last weekly analysis. Over the short term the market is deeply overbought, however it has broken out the previous consolidation range at the upside. We have to see how the market pulls back in the next week and judge whether the trend is upward.
Overview of World Markets and Sectors
In this week the US market is much stronger than the other parts of the world, which is show in the following chart.
 (world markets)
 (relative strength)
The next chart shows the MSCI World/EAFE/Emerging Market, Shanghai Stock Exchange Composite Index, Hang Seng Index, and Nikkei 225 index. Most markets have recovered significantly from the November low. Besides mainland China market, other markets are making higher low, which is a bullish sign.

Major indices, commodities, and US dollar are shown in the next chart. The crude oil is bouncing back, and this causes the strong rebound of commodities. At the same time, gold is making higher low and high, and US dollar is bullish too. Among the major indices, DJIA is relatively weaker, Nasdaq and Russell 2000 are stronger. Frankly speaking, the markets look bullish (over the short term).

Sector overview chart. Only XLV and XLY are still stronger than others, XLF is the weakest, technology and energy sectors are at the resistance.

SPX
Now it's very clear that the wave C of 4 has not finished. And the alternative counting of wave C should be valid. Based on this counting, the intermediate term trend is bullish and the potential target could be 967 or even 1035. The next stop could be 946. However this doesn't mean SPX should go there in a straight way, actually there should be a major pullback before reaching the top.
 (SPX daily)
On the P&F chart, we can see that the first breakout is at 880-885, and the second at 915-920, now SPX is approaching the next stop at 945-950 which agrees with the Fibonacci level.
 (SPX)
Last weekend I under-estimated that SPX should go to 880-890 before dropping to 860, now it has reached much higher. Assuming SPX is still in corrective wave, I expect it pulls back to 885-900 in the near term.
 (SPX hourly)
XLF and SKF
Last weekend the sell signal of SKF was confirmed and now it got deeply oversold. IMO the SKF is a buy and the short term target is 114-115 once it takes off.
 (SKF hourly)
Forex
USD/CAD: it seems the downside space is still pretty big.

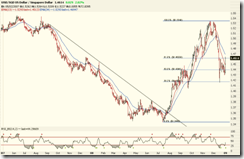
USD/SGD: still the previous outlook, further rebound is expected after a moderate pullback.
EUR/USD: expecting further weakening.

Commodities
No update to the long term.
In the short term I expect gold to pullback a bit.
 (/ZG daily, Gold 100-oz futures)
The daily chart of the crude oil looks quite funny (left), so let's take a look at the hourly chart.
 (daily)
 (hourly)
Miscellaneous
The US treasury-bill and treasury-note futures are breaking down. This is bullish to the stock market.
 (30-yr T-bond)
 (10-yr T-note)
Housing index futures: no improvement on the chart. This should be reflected into URE soon or later.
 (composite housing index)
Matthew's charts
VIX long term chart: buy signal.
INDU - weekly long term: positive. bottom in place. buy.
Dow daily TRIX: still a buy signal.
SPX LT Stochastics: bottomed out. buy.
S&P 500 Projection: wave 3 finished. Bottomed out.
S&P500 trend chart:
SPX daily TRIX: same as INDU.
NASI 1 year: buy signal.
$CRX - Commoditiy Related Equity Index: I think it's a buy signal. Good news for commodity stocks.
SSO system: buy.
SDS system: short.
Index All:
Dow 60-min:
put,call and put,call 10 day: the market should continue to have a tailwind.
SPX 15:
USD monthly: