[Last weekly analysis.] In the last week, the market broke out of the consolidation region with increasing volume and briefly went over the previous swing high on the weekly chart. The trend is confirmed to be up. Also note that if EMA13 crosses over EMA34, the bear market should be considered as finished and the big trend will be up.
 SPX weekly
Overview of World Markets and Sectors
From the following charts, US market is going up again after a minor consolidation while other markets are even more bullish. We can also see that the emerging market shows the greatest strength. Although the big rally might be primarily led by commodities, this is certainly a good sign.
 World markets weekly
 relative strength
The next chart shows the MSCI World/EAFE/Emerging Market, Shanghai Stock Exchange Composite Index, Hang Seng Index, and Nikkei 225 index. While the charts look choppy the trend is all up.

Major indices, commodities, and US dollar are shown in the next chart. Stock market is heading higher, crude oil is going up without pulling back, while the US dollar is bouncing back and causes the consolidation of commodities.
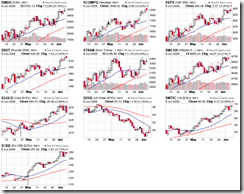
Sector overview chart. Technology and Industrials closed at a new high, while financials are falling behind (pay attention to MA20). No sector is significantly weak.

Emerging market charts:
 EEM weekly. Up trend confirmed?
VIX: volatility has been back to normal range.
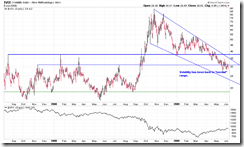
TED spread: back to normal.

SPX/ES
The intermediate term trend is still up although some negative divergence can be clearly seen on the daily chart. Before breaking down 923, the trend will remain to be up.
 Daily chart update
 negative divergence
From the perspective of Elliott waves, the impulsive wave might be complete and the market may consolidate for a while or pull back. If ES goes above 947.5 then this counting will be negated and we will look forward to a new high. If ES falls below 923, we might see a deep pullback.
 ESM9 2-h
P&F chart: the trend is still up; major support is at 875; immediate support is at 930; if SPX falls below 925, an intermediate term downtrend may be unfolding.
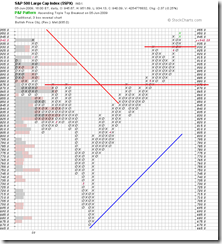
Trading idea: wait for the pullback, buy dip if:
XLF and SKF
XLF is unable to make a new high while the broad market goes higher. The key resistance is at 13. It seems that the consolidation will last for a while.
 XLF daily
 XLF hourly
Currency Futures and Forex
EUR/USD: the uptrend is likely reversed.
 EUR/USD daily
USD/SGD: positive divergence plays out, and the trend is being reversed up.
 USD/SGD daily
Commodities
Crude oil: the uptrend is still very strong, and the strategy is to buy dip.
 $WTIC monthly
 $WTIC daily