MID-TERM TREND
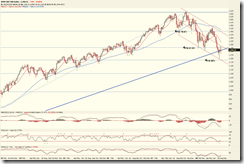
The following is the 5-year weekly chart of DJIA. Note that the Fibonacci Retracement connected from the last bear market bottom to the last year top, it seems each retracement level plays a role of support/resistance, and the troughs of DJIA sit right on the line. I expect the July bottom is the bottom in the mid-term, however there might be another round of selling off which will holds the Fib 50%.
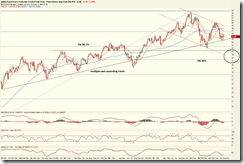
SP500 Weekly Chart: compare with DJIA weekly chart, my feeling is that the July bottom is not low enough. I am thinking it may go down at some point to significantly break the Fib 50%. By using the Fibonacci Expansion, I expect the next bottom is at 1170-1175, which will be a mid-term profitable one. The market during the past few weeks looked very risky for me, and I am waiting for the next leg down to bottom fishing.
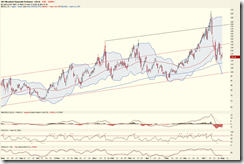
QQQQ Weekly Chart: From my point of view QQQQ has not broken the long-term ascending trend line, seems very bullish and strange. If we are indeed in a bear market QQQQ might keep synchronized with DJIA and SP500 eventually, therefore the downside space is quite big. I am holding QID and wish it will be profitable.
NEAR-TERM TREND
DJIA daily chart: what worries me is the lower high higher low pattern. I hope it can go above Fib 38.2% which is the previous high. The mid-term signal is okay, and the lower edge of the descending channel seems providing a support. However I doubt how big the upside room is after breaking the Fib 38.2%.
SP500 daily chart: it looks slight better than DJIA, but it has to break the middle of the descending channel and the resistance line. Due to external intervention, I hope it can break above the resistance early next week. If it cannot, it could repeat the February pattern. I am holding some SSO and hope it doesn't give me a tiny profit.
Here is the chart I just drew. It seems SP500 is forming a rising wedge, which is bearish but not necessarily going to plunge immediately. The end of next leg is put at 1170 according to my reading on the weekly chart.
XLF daily chart: the ascending channel might be too steep to persist, and MA50 seems blocking the bullish momentum for the past few days. Also the lower highs and higher lows look like a breakout is due soon.
SKF daily chart: I bought in too early. I expect it goes down to the lower edge of the ascending channel, and probably a little bit deeper, and then buy some and hold for some time.
USD/JPY
In the near term USD/JPY looks bearish which might affect the stock market due to the carry trade.
INTRADAY CHARTS
XLF 60-min: is it a bull flag? If it is then it will go above 23 for sure.
SKF-60min: it looks like a bear flag, which is consistent with the XLF 60-min chart.


No comments:
Post a Comment