Here is the SPX daily chart:
We can see that SPX reached the region of 1165-1172 that I mentioned yesterday and did get stabilized. Very likely we will see a short term rally this week. However, from my point of view the wave structure is incomplete so SPX needs a final push which will be a minor wave 5. Of course it can be lower or higher (exhausted) than 1169. I believe we don't have to chase the high at the moment, because there will be a better entry point.
SPX 60-min chart:
This is a tradable bottom. Let's open long positions and ride the wave up!
XLF 60-min chart:
It has reached the target projected yesterday. Now it's going up, and the near term target is Fib 61.8. Remember that we are in a bears market, nevertheless we can trade any rebound.
Forget about SKF for now. Let's trade UYG until the trend is about to revert.
QQQQ 60-min:
QQQQ looks very weak. It will go up for sure, but most likely it won't go beyond Fib 61.8 before another down leg gets started.
---------
SSCC 60-min chart:
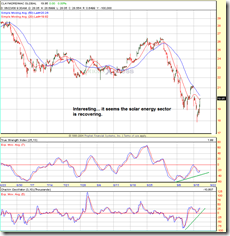
TAN (Claymore / MAC Global Solar Energy Index ETF) 60-min:


No comments:
Post a Comment