In the weekend I expected the market pulled back a bit and then consolidated, but I didn't expect it could go down so sharply -- of course the news concerning AIG and LEH played an important role. Now the charts are changed and I don't know precisely where the market will go precisely. My feeling is that:
- The market may have a relief briefly till this weekend;
- A new selling-off may start in the next week or some point after this week.
Look at the SPX daily chart first:
The market has reached Fib 50% level and may take a rest here. However very likely it will go to 1165 - 1172 and have a bigger consolidation over there. The final target might be 1075. Let watch out around 1165-1172 first.
SPX 60-min chart:
Just for your information. There is no measurement on the chart.
XLF 60-min chart:
In general it should follow the broad market but recently it didn't. I guess the next stop is 18.x and then the final target might be 16. The final target seems scary, I am not really convinced but will take it as a warning.
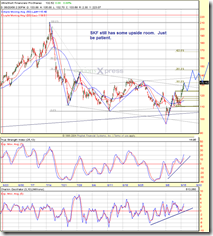
SKF 60-min chart:
Just for your information. 140 will be reached for sure, most likely the next stop will be 146. But don't count on me.
No QQQQ/QID chart today. They look ugly and are not attractive at all.
---------
SSCC 60-min chart:


No comments:
Post a Comment