Today is a historical day. I think it is the biggest one day rally since the great depression. However I don't think it marks a beginning of next bull market or even intermediate term.
No daily charts today. It seems SPX, XLF and SKF went exactly as the charts drawn last Friday. I will check if anything changes tomorrow.
A few interesting charts:
SPX 60-min:
It looks very interesting (Fibonacci was there last Friday evening). SPX reached Fib 38.2 precisely, and ESZ8 reached 1050. Tomorrow market makers should have broken even. Then what? Let's see. But market makers should push it higher to get some profit.
XLF 30-min:
Rally isn't over yet.
SKF: fill the gap at 112?
TED spread: (when I am writing this) why does it refuse to drop down? It should drop to 3 or below otherwise the credit market is still frozen.
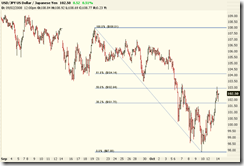
USD/JPY 2-hour chart: see how it goes tonight.


No comments:
Post a Comment