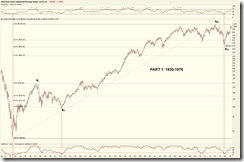
DJIA: complete counting from 1929 great depression to now.
Close up part 1: wave I, II, III, and IV.
Close up part 2:wave IV, V and present.
Compare with DJIA, SPX isn't so regular in term of proportion between waves. Nevertheless it is worthwhile to take a look because this is the primary gauge I am watching for a long time.
Complete counting from 1929 great depression.
Close up part 1: wave I, II, III and IV.
Close up part 2: wave IV and V. The projected target over the intermediate to long term is 820 or lower.
It is prudent to wait for the reversal of RSI(34) before changing the long-term strategy from short to long. Note that signal on RSI(34) and oversold of STO(55,1) may indicate the start of new bull market.


No comments:
Post a Comment