P&F chart:
Weekly chart:
No sign of bottom yet!
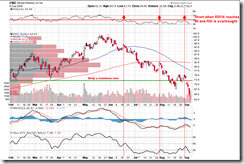
Daily chart:
$72.5 is a resistance now. Later it is safe to short it everytime RSI14 reaches 50 and RSI becomes overbought.
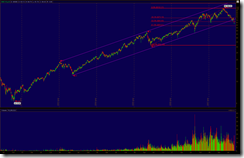
Long-term wave structure:
Wave 3,4,5 on the weekly chart:
PLAN: Close the position as soon as wave B is finished (not started yet); short it.
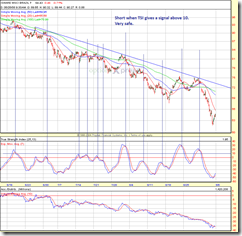
60-min chart:
The plan is written on the chart, and the success rate is VERY HIGH!


No comments:
Post a Comment