SP500 daily chart and wave counting:
Here is the update of the chart in the last weekly analysis.
XLF daily chart and wave counting:
Update of the last chart.
I also have a SKF daily chart as follows:
SPX 60-min chart:
The upside target is 1270. After reaching (or overshooting) that point, I expect a downside movement. Will the rate cut by Fed be a stimulus to the spike? Let's wait and see.
XLF 60-min chart:
It was weaker than my expectation. I still look forward more upside movement before diving down.
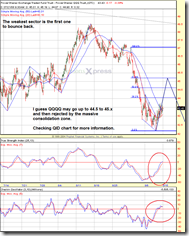
QQQQ 60-min chart:
No touching it for now. It was the weakest but might become the earliest sector that bounces back.
QID 60-min chart:
It is bearish. Wait and pick it up later.
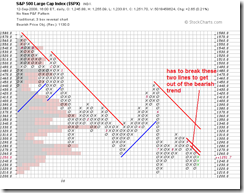
Here are three P&F charts.
SPX:
XLF:
SKF:
Intraday chart for ESZ8:


No comments:
Post a Comment