Yesterday I thought today could be a consolidation so I didn't add any short position this morning. And I was too busy to watch the market today, so I only got a tiny profit on my existing SDS and SKF. After reading other people's analysis I had some bullish bias yesterday I thought the Wall Street would set us up and push SPX to 1280+. However the situation is not complicated. The market simply sold off, again and again.
Here is the SPX 60-min chart:
We are in 3 of 5 and I expect 1200 is broken out after 5 of 5 is finished.
XLF 60-min chart:
Both the momentum and volume pattern look bearish.
SKF 60-min chart:
Now it seems the down trend has been reversed. I plan to buy on dip.
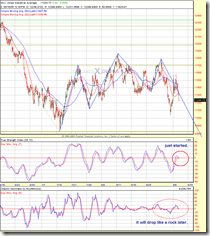
INDU 60-min chart:
Take notice at the TSI and Chaikin oscillator. Most likely a bigger selling-off is coming soon (at least not ending soon).
SPX daily:
Very likely SPX will go further down. We are now in 3 of 5 on the chart, and the final target of wave 5 is around 1120.
SPX weekly:
I am not entirely convinced by the bullish falling wedge because it is inconsistent with the wave counting. Anyway the chart says no long before ~1160.
I have decided to follow the trend instead of to be against it.


No comments:
Post a Comment