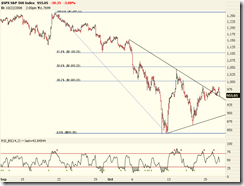
Another consolidation day. Soon many people will believe that the worst has passed and the market will recover on its own. Let's see.
SPX daily looks the same as expected, and the corrective wave is so obvious on the chart.
So the picture hasn't really changed.
SKF has no clear-cut direction, so stay away.
SPX 30-min chart looks like a breakout and kiss-back:
XLF 60-min chart has a prolonged consolidation region, but now both momentum and volume are pointing down. This pattern is quite bearish, especially on SPY and INDU. Over the very short term the market is bearish, and consolidation may break out at the down side.
ES (S&P 500 index futures) looks bearish on the 30-min chart, hopefully Fib 38.2% can hold, otherwise the situation will become ugly.
TED spread looks much better now. So is Matthew's VIX chart.


No comments:
Post a Comment