Here is the last weekly analysis. Now new impulsive wave has started, no betting on long, short on any rally until SPX reaches a new low.
Market Overview
Volatility is still high: daily chart and hourly chart of $VIX (CBOE Volatility Index)
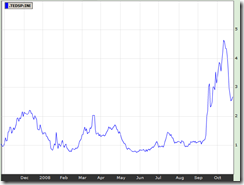
TED spread looks fine but this doesn't mean it is time to go long.
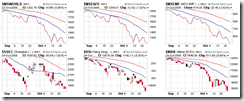
The following chart shows the MSCI World index, MSCI EAFE index, MSCI Emerging Market, Shanghai Stock Exchange Composite Index, Hang Seng Index, and Nikkei 225 index. The entire world is tanking while the emerging market is the worst. But mainland China looks slightly better.
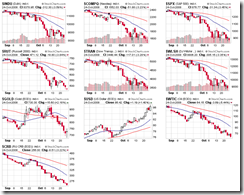
Major indices, commodities, and US dollar are shown in the following chart. We got new lows, terrible.
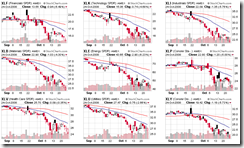
Sector overview chart: triangles everywhere, all sectors are about to crash?
Glance of major indices and bullish percent: faked up signal in the last week has gone away.
Wave Counting
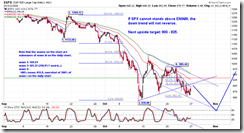
SPX: [left] counting on the daily chart; [right] detailed counting on the subwave of subwave iii of wave 3. Oct 10th low might be taken out in the next week. I am not expecting dramatic movement at the time being.
XLF: I don't closely watch on XLF any longer because it's easier to trade SKF. The chart only shows that XLF will have a new low, and might go under $10.
SKF is a short but it will likely go higher before turning down. The downside target is 120-145.
QQQQ: approaching the target.
Currencies
USD/CAD: bounced back up from Fib 61.8% and headed down. This is the last support, if it goes further the wave counting will be invalid and it will go to 1.4 as a minimum target.
USD/SGD: the chart explains everything.
USD/JPY: very scary. It's now back testing the breakout point.
USD/EUR: due for a pullback?
Currencies
Gold (continuous adjusted): Here is the monthly chart of gold price since 1974. It's at a key support/resistance level.
Crude oil (continuous adjusted)
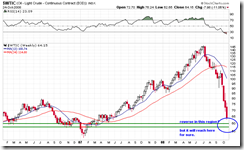
The following chart [left] shows the adjusted crude oil price since 1983.
$WTIC on stockcharts.com might be unadjusted. FYI.








No comments:
Post a Comment