$SPX LT Stochastics: we still have one more decline to new lows for a 5th wave.
$INDU - weekly long term: likely target range is 2002-2003 lows.
$SPX and $INDU daily TRIX: it appears that TRIX crossovers have been working well for catching the trends.
SSO mechanical system
$VIX long term: TRIX no crossover yet, so bottom not confirmed.
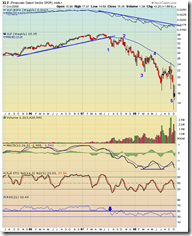
XLF daily:
$NASI 1 year: conservative traders could wait for the NASI to give a PSAR buy signal.
Commodities - CRB daily:
Commodities - CRX
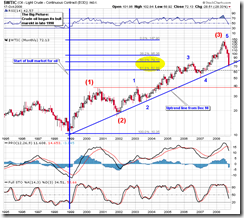
Commodities: light crude oil


No comments:
Post a Comment