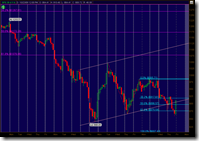
SPX daily (only the last primary wave): the minute wave (iv) is likely over, and the next wave has started since yesterday. Today's candle touched Fibonacci expansion 1.618. On futures chart, the wave (v) is more clear.
SPX hourly: target 807.5.
 (SPX hourly)
 (ES intraday chart)
XLF 60-min: retest the broken support line and farewell!
SKF daily: no long above the upper red line, no short below the lower red line, no trade in between.
SDS daily: same wave structure, too bad the entry point is missed.
------


No comments:
Post a Comment