Here is the last weekly analysis. In the past three weeks the market has been continuously going down. On the first trading day of this week, the market sold off massively and later it was bounding in the range set on Tuesday. At the end of the week, the market conditions are mostly neutral.
 (SPX daily)
 (SPX daily)
Overview of World Markets and Sectors
From the weekly chart of world markets comparison, the whole world is sinking again and the emerging market is losing the steam.
 (world markets weekly)
 (relative strengths)
The next chart shows the MSCI World/EAFE/Emerging Market, Shanghai Stock Exchange Composite Index, Hang Seng Index, and Nikkei 225 index. There is no sign of reversal at the moment.
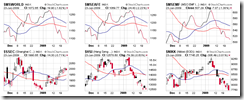
Major indices, commodities, and US dollar are shown in the next chart. Note that the crude oil is making a higher low, and the commodity sector is reversing, which could possibly stabilize the market.

Sector overview chart. Again, the financial sector is extremely weak, which the energy sector is not so bad in this week (probably the oil helped a lot).

SPX
In term of wave counting, scenario (A) and (C) turned out to be invalid, and the only possible way is (B).
 (SPX daily, inverse chart)
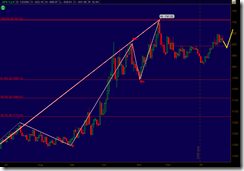
On the P&F chart, we can see that SPX is making a symmetrical triangle pattern, but this pattern can be resolved at either up or down side. For bears, the important level to watch is 860.

Last week the estimation based on the hourly chart was too optimistic. The Obama rally didn't happen and the market headed down from the beginning of the week. This week the sub wave 2 seems unfolding and thus I estimate the upside target of SPX is 855 in the near term.
 (SPX daily)
XLF and SKF
On Tuesday XLF was almost crashed. However the money seems flowing in. We could see a dead cat's rebound in the next week. The technical indicators of SKF on both daily and hourly charts are neutral to bearish.
 (XLF daily)
  (SKF daily)
Forex
No update to USD/CAD and USD/SGD.
EUR/USD: It has broken through the important support level.

Commodities
Gold: keep an eye on the ascending channel and the trend line to see if the up trend is sustainable.
 (/YG daily, Mini Gold Futures)
Crude oil: the trend in the very short term (hourly chart, not even on the daily chart) is UP.

Matthew's charts
VIX long term chart: signal reversed, it's time to short the market.
INDU - weekly long term:
Dow daily TRIX: reversed to sell signal.
SPX LT Stochastics: bottomed out. buy.
S&P 500 Projection: wave 3 finished. Bottomed out.
S&P500 trend chart:
SPX daily TRIX: same as INDU.
NASI 1 year: sell signal confirmed.
$CRX - Commoditiy Related Equity Index: buy signal has been confirmed.
SSO system: sell.
SDS system: buy.
Index All:
Dow 60-min: falling wedge
put,call and put,call 10 day: no bottom yet.
USD monthly:


