Here is the last weekly analysis. Now we got a short-term rally, a really violent one. My strategy is changed to short on rally of ultrashort ETF's cautiously -- in another words short-term long.
Market Overview
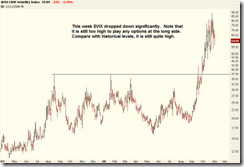
The volatility dropped down in this week although it is still very high. On the right it's Matthew's VIX chart.

TED spread didn't change so much but it looks better than the last few weeks.

The following chart shows the MSCI World index, MSCI EAFE index, MSCI Emerging Market, Shanghai Stock Exchange Composite Index, Hang Seng Index, and Nikkei 225 index. One can see that almost all markets are bouncing back.

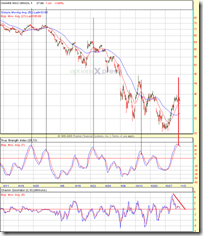
Major indices, commodities, and US dollar are shown in the following chart. Stocks seem being improved, but commodities are still at a low level.

Sector overview chart: all sectors look identical, there is no clear winner.

Glance of major indices and bullish percent: they look like mid-term long, but I am not convinced.

Wave Counting
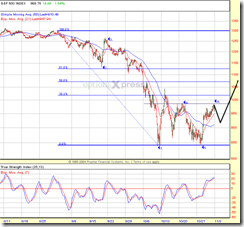
SPX: [left] overview of waves; [right] close up. Wave are in wave iv of wave 3.


 (SPX-60min)
QQQQ: consistent with SPX.

SKF: bounce over 140 is a short.

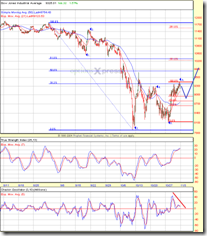
INDU 60-min and SPX 60-min:
Forex
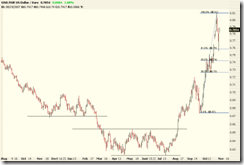
USD/CAD: the recent crash and violent rebound have invalidated the previous wave counting. Now it has approached to a resistance level. My feeling is that it may go back to 1.1 in the near term.

USD/SGD: approaching to a resistance.

USD/JPY: it is recovering but don't forget the primary trend.


USD/EUR: the game is paused but not over yet.
Commodities
Gold (continuous adjusted): Here is the monthly chart of gold price since 1974. It's at a key support/resistance level.

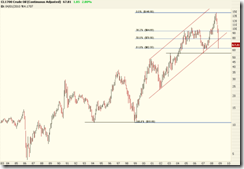
Crude oil (continuous adjusted)
The following chart [left] shows the adjusted crude oil price since 1983. It dropped to Fib 61.8% precisely.

Matthew's charts
INDU daily: If it can break the upper edge of the consolidation region, it will be quite bullish. Note the TRIX has given a signal.

SPX TRIX: bullish.

NASI: mid-term signal is almost there.

SDS system: signal is short.

Others
EWZ: short! so is FXI. Many ETF's are due for a pullback in the beginning of the next week.