Today is the end of 2008, an extraordinary year when the market made the remarkable selling-off. Let's check the SPX chart of different time frames first.
 (SPX daily, roughly in the down channel, still in consolidation)
 (SPX weekly)
 (SPX monthly)
 (SPX 60-min)
 (SPX 15-min, the downside target is still the previous resistance zone 880-885)
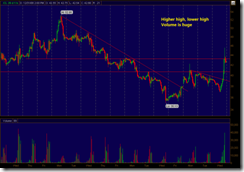
 (SPY 5-min, note the largest volume bars and corresponding price levels)
 (/ES 1-min)
 (/CL, the crude oil, bullish)
 (/DX, the US dollar index future, failed at the resistance)
 (SKF hourly, it's a buy. If it goes below 103 on Friday, buy more)
Summary: the market is at the short term top and should pull back immediately. However, should SPX go up to 918 it may rally much further although this scenario is very unlikely.
Trading system signal: buy SKF at the market open.


No comments:
Post a Comment